Unbound (KernDiff)
I've been getting into CUDA for the past month, and profiling GPU kernels (functions that run in parallel on the GPU) always felt painful. You run NSight Compute (NCU, a kernel profiling tool for debugging), on v1, stare at the metrics, run NCU on v2, then try to hold both profiles in your head simultaneously. AMD actually ships a tool for this, ROCm Compute Profiler has a baseline comparison mode, but it's a GUI backed by Grafana and MongoDB, targets MI-series accelerators, and assumes you're running a full high-performance compute profiling pipeline, not comparing two .cu files. As such, I built KernDiff: a CLI tool that takes two kernels, compiles and profiles both, and produces a structured diff of GPU performance metrics. The design is close to that of hyperfine or benchcmp.
In action
Let's take two kernels, an unfused Mamba SSD pipeline (3-kernel pipeline) vs. a single-pass fused version (a single kernel) on A10G:
v2 is 1.14x faster  (214.1us -> 188.4us)  [v1: 214-259us ±5%  v2: 188-250us ±6%]
  note: clocks not locked — deltas below 10% may not be reliable
  metric                              v1              v2       delta
  ------------------------------------------------------------------
  latency                    214.1us ±5%     188.4us ±6%      -12.0%  +
  dram_bw                          324.3           540.4      +66.7%  ++
  ptx_instructions               5636096         3014656      -46.5%  ++
  sm_throughput                    19.6%           12.8%      -6.9pp  --
  sm_occupancy                     93.8%           84.5%      -9.2pp  - ?
  warp_stall_mio                   145.7           132.4       -9.1%  + ?
  memory_throughput                 1.1%            1.0%      -0.1pp  - ?
  ------------------------------------------------------------------
  roofline                         54%bw           91%bw  bound: memory  9% headroom
KernDiff tells us the story immediately: DRAM Bandwidth (dram_bw) nearly doubled (324 → 540 GB/s) and ptx_instructions dropped by half! Additionally, it confirms that the three high-bandwidth memory (HBM) round-trips collapsed into one in the PTX (NVIDIA's intermediate assembly language, sitting between your CUDA source code and the final GPU machine code) diff by ld.global going from 6 → 3, st.global 3 → 1, and bar.sync, membar.gl disappearing entirely. Finally, the roofline moves from 54% to 91%; 9% headroom you're basically done optimizing the kernel (or are you?)
The ? marks on sm_occupancy and warp_stall_mio tell us that they are within the noise floor, so the difference isn't too telling
pp = percentage points, the direct difference between two percentages, so 19.6% → 12.8% is -6.9pp, not -35%
How it works
KernDiff goes through this pipeline: compile both kernels → profile → compute diff in metrics → render.
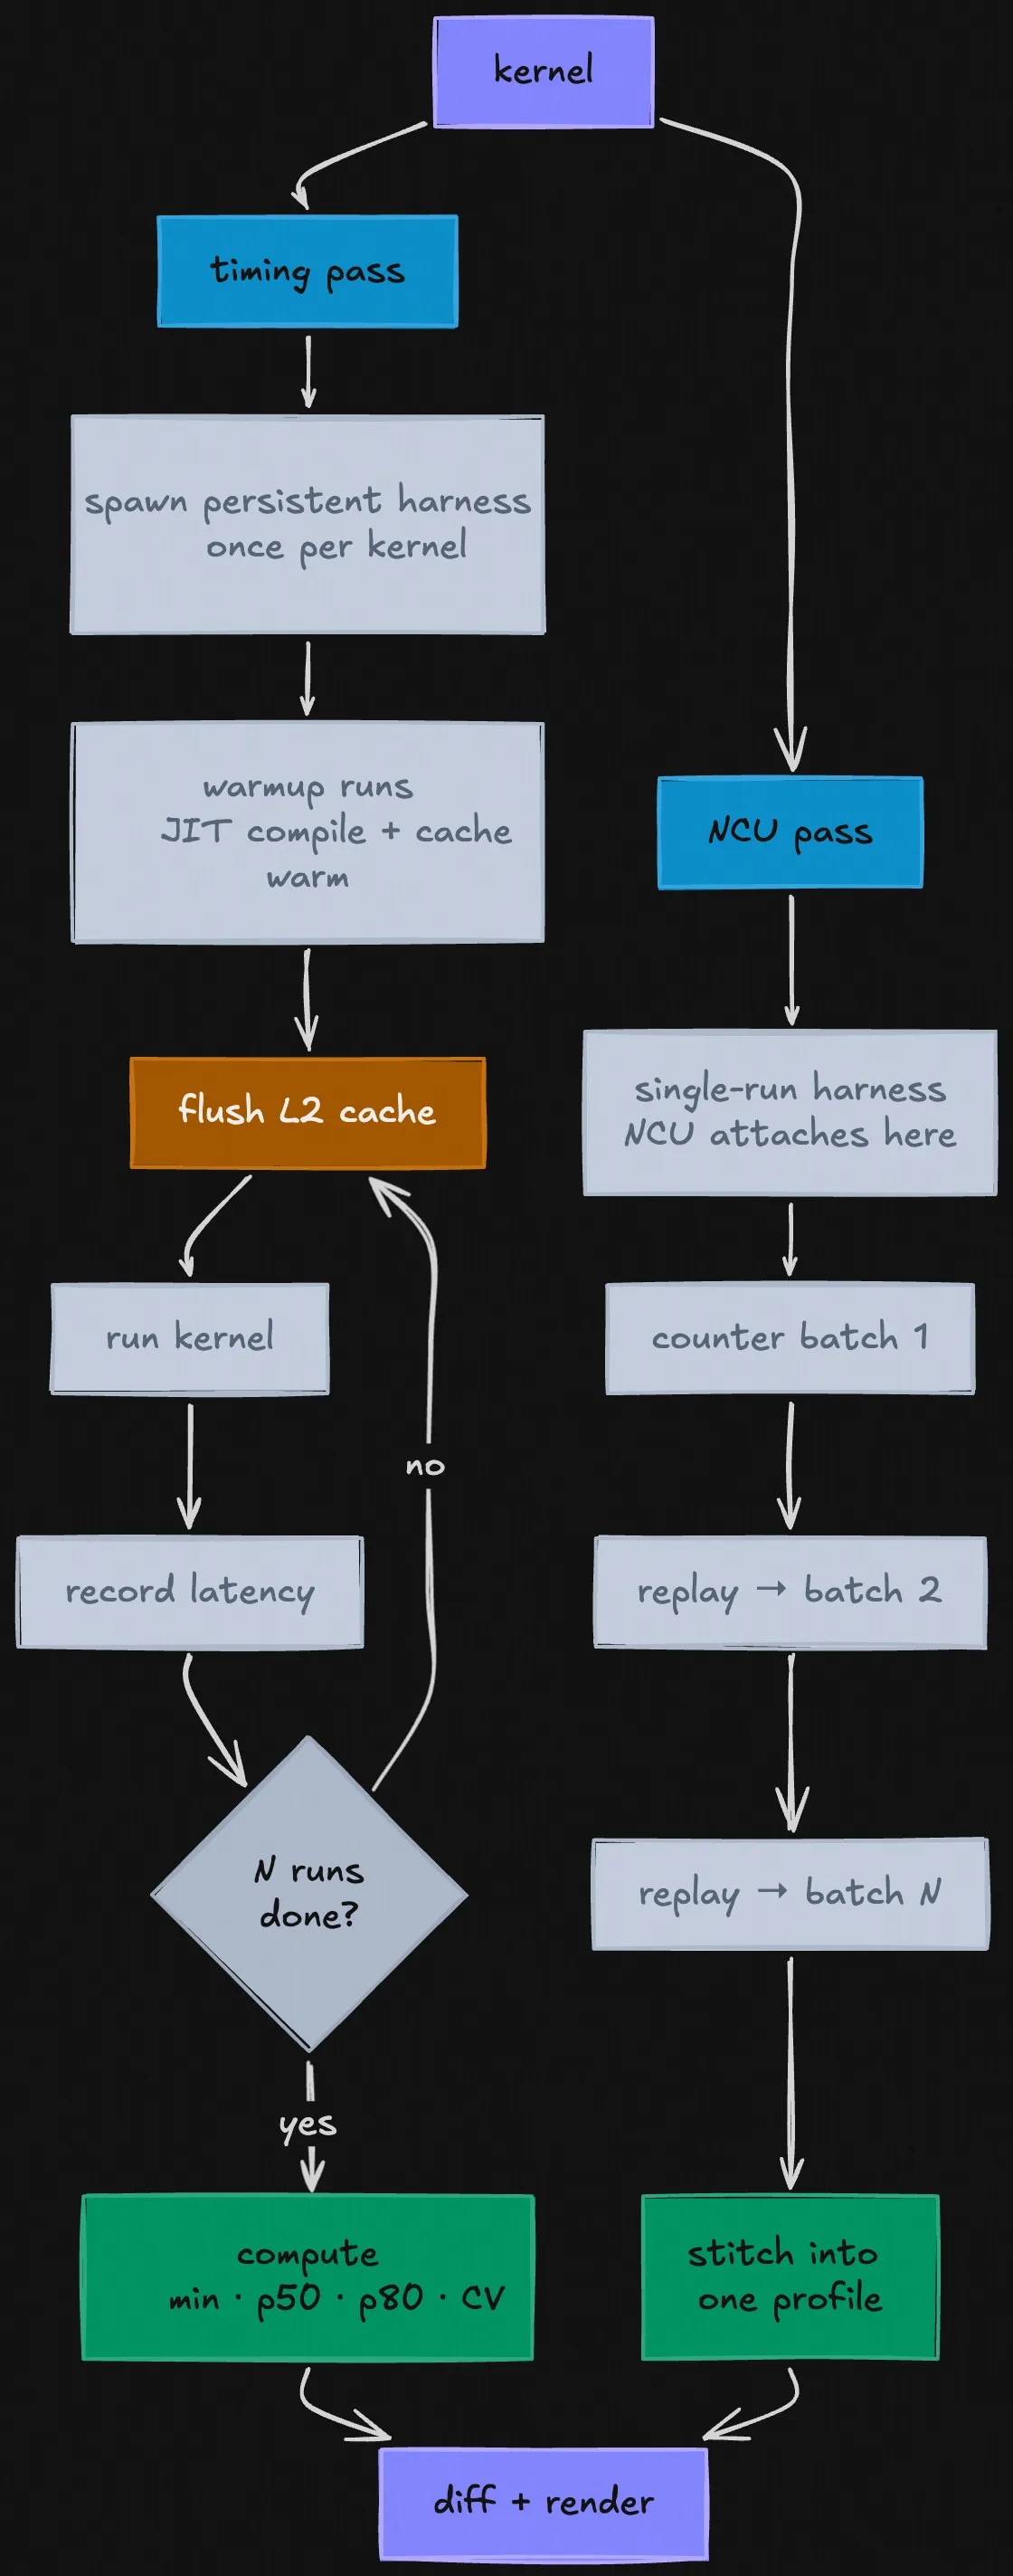
KernDiff profiling pipeline
Why N runs instead of one? A single kernel run is too noisy to trust. GPUs don't run at a fixed speed, the clock (the internal tick rate that determines how fast instructions execute) fluctuates based on temperature, power draw, and load. A kernel that runs at full boost clock on the first run might be 10% slower on the second because the chip got warmer. Other processes can also compete for memory bandwidth between runs.
For profiling, each kernel gets two passes. The first is a timing pass, the N runs from the wrapper above, filtered for outliers, giving us a min/p50/p80 with a coefficient of variance. The second is an NCU pass: KernDiff invokes ncu with a fixed set of GPU performance metrics and parses the CSV output. NCU works by replaying your kernel multiple times internally. GPUs have hundreds of built-in event counters: physical registers on the chip that track things like "how many bytes were read from memory" or "how many times did a thread stall waiting for data". But since it can only read a limited number at once, NCU runs your kernel once to collect the first batch, again for the second batch, and so on, then compiles everything together into one profile. This is why the real data in the buffers matters, every replay needs valid inputs or the kernel takes a different code path and the counters from different replays won't be measuring the same thing.
One caveat: NCU has to replay your kernel several times to collect all its hardware counters, GPUs can only read a limited number of counters per run, so it takes multiple passes. The problem is that each replay leaves the GPU's cache in a different state than the one before it, so later passes aren't measuring the same thing as the first. KernDiff can't fix this; NCU doesn't expose a way to flush between its own internal replays. The consequence is the hardware counter metrics (stalls, cache hit rates, etc.) are directionally correct but not exact. The latency numbers, which come from the separate timing pass with proper L2 flushes between runs, are the ones to trust.
For calculating the diff, KernDiff computes the delta for each metric, assigns a significance symbol (++ / + / ~ / - / --), and flags uncertain deltas with ?. The PTX diff is a static instruction count comparison, KernDiff extracts the low-level GPU assembly that nvcc (NVIDIA's CUDA compiler) produced for each kernel and diffs the instruction counts. Think of it as a diff of the compiled output: if ld.global drops from 6 to 3, there are half as many global memory load instructions in the compiled kernel. If bar.sync disappears entirely, you eliminated a synchronization barrier.
But these are static instruction counts from the PTX, not dynamic execution counts. If your kernel has loops or branches, the same instruction executes many times at runtime. A loop body with one ld.global that runs 1024 times is 1024 actual memory loads, not 1. For straight-line kernels like the Mamba example this distinction doesn't matter, but for anything with a non-trivial control flow, treat the PTX diff as a structural signal, not an arithmetic one.
The metrics fall into 6 groups:
sol; latency, SM throughput (SM = Streaming Multiprocessor, the GPU's basic compute unit), memory throughput, DRAM bandwidtharithmetic; arithmetic intensity (ratio of compute operations to memory bytes accessed), floating point operations per second (FLOPs), thread activitycache; L2 hit rate, L1 hit rate, bank conflicts, global load efficiencywarp_state; occupancy, and four stall types: memory, memqueue, compute, synclaunch; registers per thread, shared memory
The stall breakdown is the most telling sign, in practice. stall_memory means warps (groups of 32 threads that execute in lockstep) are waiting on GPU memory. stall_sync means warps are waiting on a synchronization barrier (a checkpoint where every thread in the group must arrive before any of them can continue, which is necessary for correctness but means fast threads sit idle waiting for slow ones.) stall_compute means they're waiting on a previous instruction to finish, common in kernels with long dependency chains where the next operation needs the result of the last one. Together these tell you why a kernel is slow in a way that latency alone never can.
Implementation details
Clock locking
GPUs don't run at a fixed speed. When they're not under much load they run faster to get work done quickly; when they've been running hard and get hot, they slow down to avoid overheating. This is called clock boosting and throttling, and it means two identical kernel runs back-to-back can produce different timings just because the GPU was warmer the second time.
The standard fix is clock locking: forcing the GPU to run at a fixed frequency for the duration of the benchmark. KernDiff tries to lock clocks at startup. On most cloud instances this requires sudo, so if you're running without it, KernDiff warns you:
note: clocks not locked — deltas below 10% may not be reliable
The coefficient of variation (CV) measures exactly this variance, it's the spread of your run times divided by the average, expressed as a percentage. A CV of 5% means your runs varied by about ±5% around the mean, likely because the GPU was running at slightly different speeds each time. When clocks aren't locked, a metric delta smaller than that variance could just be the GPU running warmer on one side than the other, not a real difference between the kernels. The ? annotation is how KernDiff flags this. For every metric, it checks whether the delta is smaller than 2x the coefficient of variation, meaning the move could just be explained by the GPU running at slightly different speeds on each side. If it is, the metric gets flagged with ?. This is seen in the Mamba example: sm_occupancy dropped 9.2pp but the CV was 5-6%, so 9.2pp is well within "could just be thermal noise" territory.
Persistent Triton harness
One thing that was always in my mind while implementing the Triton feature was "how will I account for Python launch overhead?" If you spawn a new process per run, then that's ~500 ms of torch/triton import cost every process (almost 25 seconds for a 50 run process).
The solution came about while solving correctness. Each new process starts a fresh CUDA context, meaning the GPU has no memory of what the previous process did. The L2 flush you run at startup isn't clearing out the previous kernel's cache footprint, it's just flushing an empty context. You think you're getting a cold cache between runs, but you're actually getting a cold cache before the first run and an unknown state for every run after.
The obvious answer for the correctness problem was "don't spawn a new process per run." So KernDiff spawns a single persistent Python process for the entire profiling pass. Imports happen once, warmup happens once, and then KernDiff communicates over stdin/stdout. The L2 flush now runs between each timed run inside the persistent process, after the previous kernel finishes, before the next one starts. The pipeline is surprisingly simple: KernDiff sends "time" over stdin, the harness flushes L2, runs the kernel, and writes the latency in microseconds back to stdout.
CUDA vs. Triton cross-language diffs
KernDiff supports cross-language diffs; you can point it at a .cu and a .py in the same command:
kerndiff examples/cuda_scan.cu examples/triton_scan.py --fn prefix_scan
Under the hood there are two separate backends that handle CUDA and Triton differently, but produce the same output format so the diff renderer doesn't need to know which is which.
The CUDA backend is straightforward: compile with nvcc, generate the C++ harness, run it. The Triton backend is more involved because Triton is a Python library, not a compiled binary. KernDiff generates a Python script that imports Triton, compiles your kernel on first run (Triton compiles kernels to GPU machine code the first time they're called, not ahead of time like CUDA code; this process is called just-in-time compilation (JIT)), and runs the timing loop (the code that runs your kernel N times). Eventually, both processes write the same metric output to stdout, which is what the renderer reads to produce the diff. So, from the renderer's perspective, there is no difference between a CUDA kernel and a Triton kernel.
The tricky part is the NCU pass. NCU works by attaching to a process and intercepting its kernel launches; it can't attach to a long-running persistent process mid-execution. So for timing, KernDiff uses the persistent harness. For NCU, it generates a second separate single-run Triton script that launches the kernel exactly once, lets NCU intercept it, collect all the hardware counters, and exit. The timing numbers come from the persistent harness. The hardware counter metrics come from the single-run NCU harness. KernDiff stitches them together into one table.
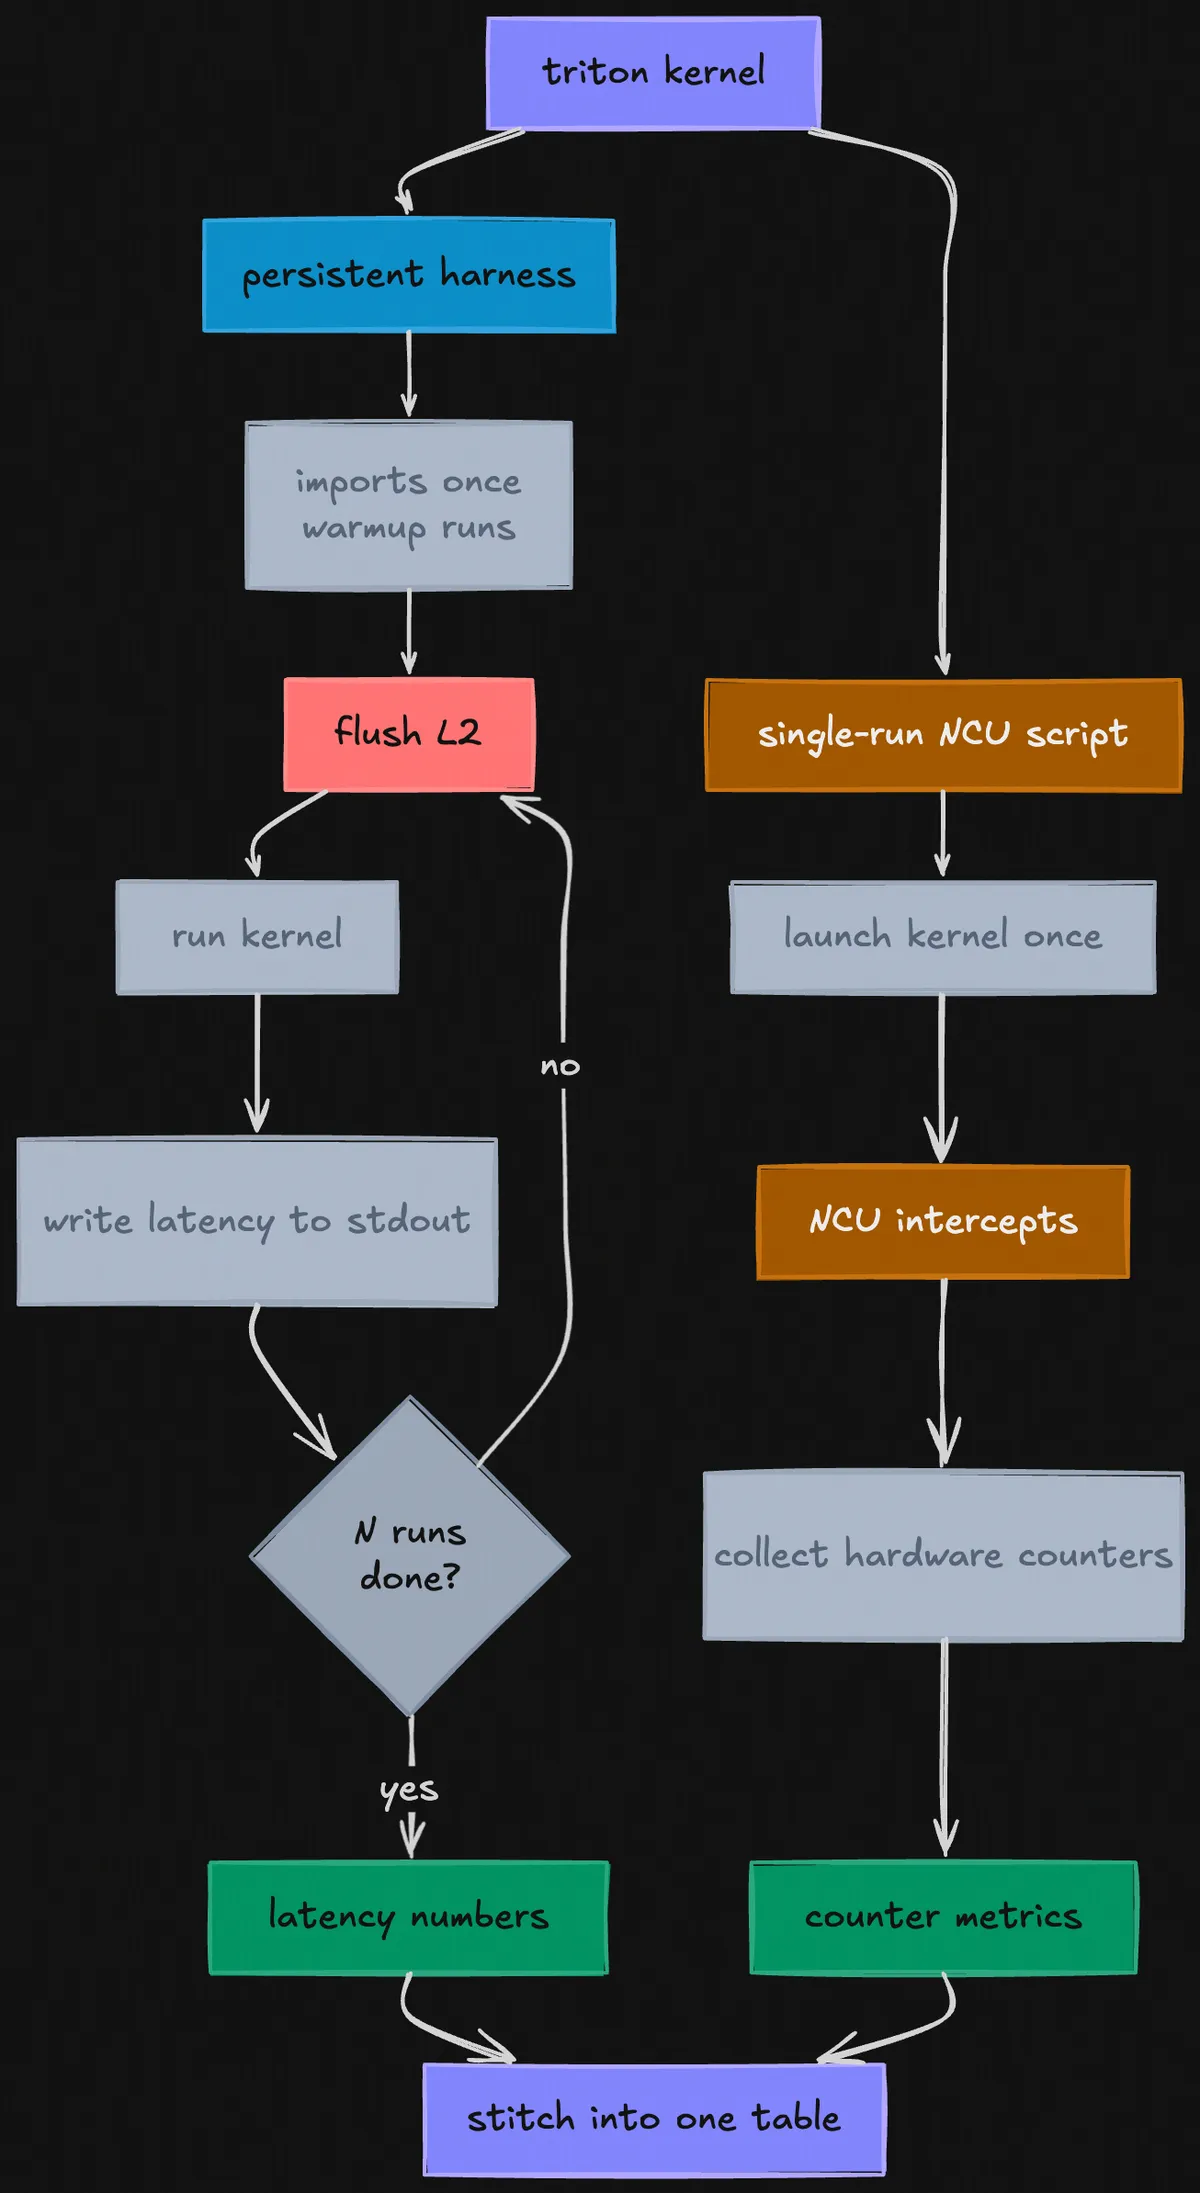
Triton kernel pipeline
At the end of the day, this pipeline gives us cross-language diffs between CUDA and Triton that just work, with the same latency accuracy and the same hardware counter coverage as a same-language diff.
Git Mode
Probably the most practical version of this project, because once you're past the "does this approach work at all" phase, the typical workflow is iterative; you have one kernel file, you make a change, you want to know what changed.
KernDiff has a single-file git mode for exactly this:
kerndiff examples/vec_add.cu --fn vec_add
KernDiff pulls the committed version from HEAD, compiles both, and diffs them:
comparing: HEAD:examples/vec_add.cu vs examples/vec_add.cu (working copy)
You can also compare against any git ref:
kerndiff examples/vec_add.cu --at HEAD~3 --fn vec_add
A natural extension of this would be comparing against kernels outside your own repo entirely, pointing KernDiff at a popular open-source implementation and diffing it against yours, i.e "how does my attention kernel compare to FlashAttention's" as a single command.
Auto kernel detection
How does KernDiff know what a "kernel" is?
In CUDA, any function that runs on the GPU is marked with the __global__ keyword. KernDiff scans your file for these, extracts the function name and argument types, and generates the launch call automatically; mapping float* arguments to buffer names, int n to N, and so on. If there are multiple kernels in the file it shows a numbered list and lets you pick.
This means for most kernels you don't need to pass any flags at all:
kerndiff examples/vec_add_v1.cu examples/vec_add_v2.cu
KernDiff finds vec_add, figures out how to call it, and runs the diff. If the auto-detected call is wrong for your kernel, you can override it with --call.
But what if I have a pipeline like Mamba's SSD and I want to compare it vs. a fused kernel? KernDiff's --pipeline N flag handles this, it tells NCU to profile N consecutive kernel launches on v1 and sum the metrics across all of them. v2 is still a normal single-kernel profile. You pass --pipeline 3 because you know the unfused side launches 3 kernels; KernDiff doesn't infer this automatically. For aggregation, KernDiff sums extensive metrics (latency, total instructions, bytes transferred) and averages intensive ones (occupancy, stall percentages, cache hit rates, SM throughput).
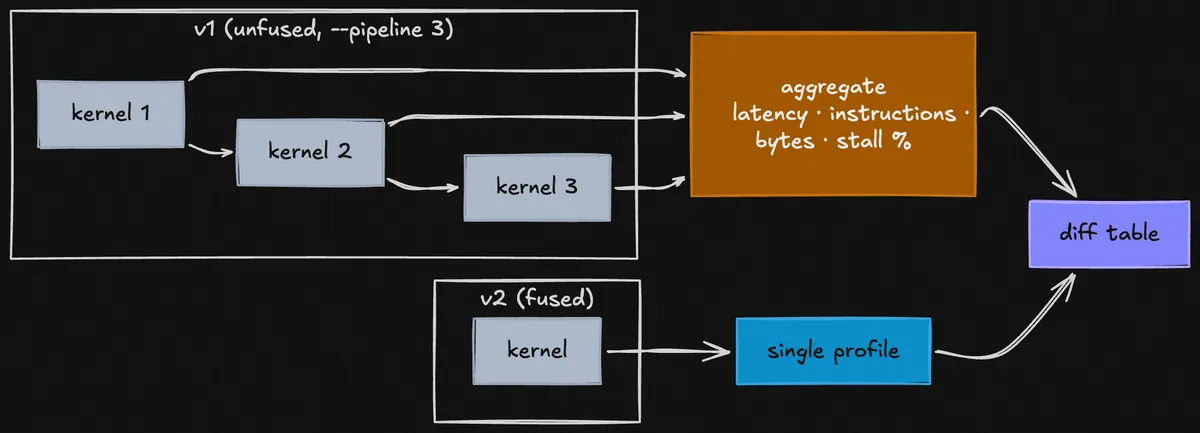
3-kernel pipeline vs fused kernel
NVML roofline
The roofline row shows how close each kernel is to the hardware's theoretical peak bandwidth or compute throughput. To compute it, you need to know what "peak" actually is for the GPU you're running on.
I was thinking of hardcoding it, but the tables will have errors (even if they're both H100, one could be SXM5 (3350 GB/s, HBM3) and the other PCIe (2000 GB/s, HBM2e)).
As such, KernDiff queries NVML (NVIDIA's management library, a C library that ships with the NVIDIA driver and exposes hardware information like clock speeds, memory bus width, temperature, and power draw) directly at runtime:
peak_bw = (bus_width_bits / 8) * mem_clock_mhz * 1e6 * 2 / 1e9
The * 2 is the DDR multiplier. DDR stands for "double data rate"; memory transfers data on both the rising and falling edge of each clock tick, so you get twice the bandwidth you'd expect from the raw clock speed alone. NVML reports the base clock speed, not the effective transfer rate, so if you forget the * 2 you get half the correct peak bandwidth.
Once KernDiff has the peak bandwidth, it computes the roofline bound by comparing two numbers: how hard the kernel is pushing memory (memory_throughput as a % of peak bandwidth) vs. how hard it's pushing compute (sm_throughput as a % of peak FLOPS). Whichever is higher wins: if the kernel is closer to saturating memory bandwidth than compute throughput, it's memory-bound, and vice versa. The "headroom" number is just 100% minus whichever utilization is higher, i.e how far you are from the actual ceiling.

Roofline model for the A10G; the diagonal line is memory bandwidth ceiling, the flat line is compute ceiling. Kernels below the ridge point are memory-bound; above it, compute-bound.
When the numbers lie
While testing it out, I wrote a test for CUDA Blelloch (v1) vs. Triton tl.cumsum (v2). It actually executed and came out as 3.21x, which felt off.
Both kernels compute a prefix scan, given [1, 2, 3, 4], produce the running total at each position. But there are two versions. Inclusive includes the current element: [1, 3, 6, 10]. Exclusive doesn't: [0, 1, 3, 6]. Blelloch computes exclusive, tl.cumsum computes inclusive. I was comparing two kernels that produce different outputs and calling one faster.
The --correctness flag exists because of this. It compares the first N output elements between v1 and v2 before reporting any speedup. If the outputs don't match, KernDiff warns you instead of crashing because sometimes you want to compare different methods.
In practice
Blelloch scan is the textbook upgrade over Hillis-Steele: O(N) work instead of O(N log N), shared memory instead of global memory. It should be faster. On A10G at BLOCK_SIZE=128, it's 1.44× slower:
v2 is 1.44x slower  (163.8us -> 236.5us)
  metric                              v1              v2          delta
  ------------------------------------------------------------------
  latency                    163.8us ±4%     236.5us ±2%         +44.4%  --
  dram_bw                          445.3           253.0         -43.2%  --
  l1_bank_conflicts                    0           3067K  +306798100.0%  --
  stall_memory                     40.3%           10.4%        -29.8pp  ++
  stall_sync                       28.4%           38.4%         +9.9pp  --
  stall_compute                     1.4%           15.4%        +13.9pp  --
  sm_throughput                    72.4%           84.7%        +12.2pp  ++
  roofline                     v1: 74%bw       v2: 85%sm  bound: mem->com
l1_bank_conflicts went from 0 to 3 million. Shared memory on a GPU is divided into banks: if multiple threads try to read from the same bank at the same time, they get serialized and wait in line instead of running in parallel. Blelloch's stride access pattern at BLOCK_SIZE=128 repeatedly hits the same bank on every pass. stall_sync rose 10pp, stall_compute rose 14pp; the kernel is stalling on barriers, not doing useful work. With this, the fix becomes clear either reduce BLOCK_SIZE to avoid the conflict pattern, or switch to a warp-shuffle reduction that bypasses shared memory entirely.
What's next
The immediate priority is shape sweeps as a first-class feature, --shape 256,512,1024 runs the diff at each buffer size and produces a summary table. This would answer "does this optimization hold across sequence lengths?"
I had a lot of fun making KernDiff; CLIs have been all I've been writing for the past 2 weeks now (Thanks 15-213!) Project is open-source, feel free to open PRs.