Profiling Inference (hotpath)
Two teams are running the same model on the same hardware. Team A's p99 time to first token (TTFT) is 340ms. Team B's is 1.2 seconds. Both are using vLLM (an inference server for LLMs) with default settings. Team B has been tuning batch size for a week. The difference isn't the hardware or the model, but rather that Team A knows their workload is prefill-heavy and their KV cache is hitting 90% utilization at peak. Team B doesn't know either of those things.
The standard tools don't surface this. Client-side benchmarks give you one end-to-end number. Server logs are hard to correlate with what the GPU was actually doing. Nsight Systems, NVIDIA's system-wide profiler, records everything but produces binary timelines designed for manual inspection in a GUI, not for extracting per-request numbers from a live server.
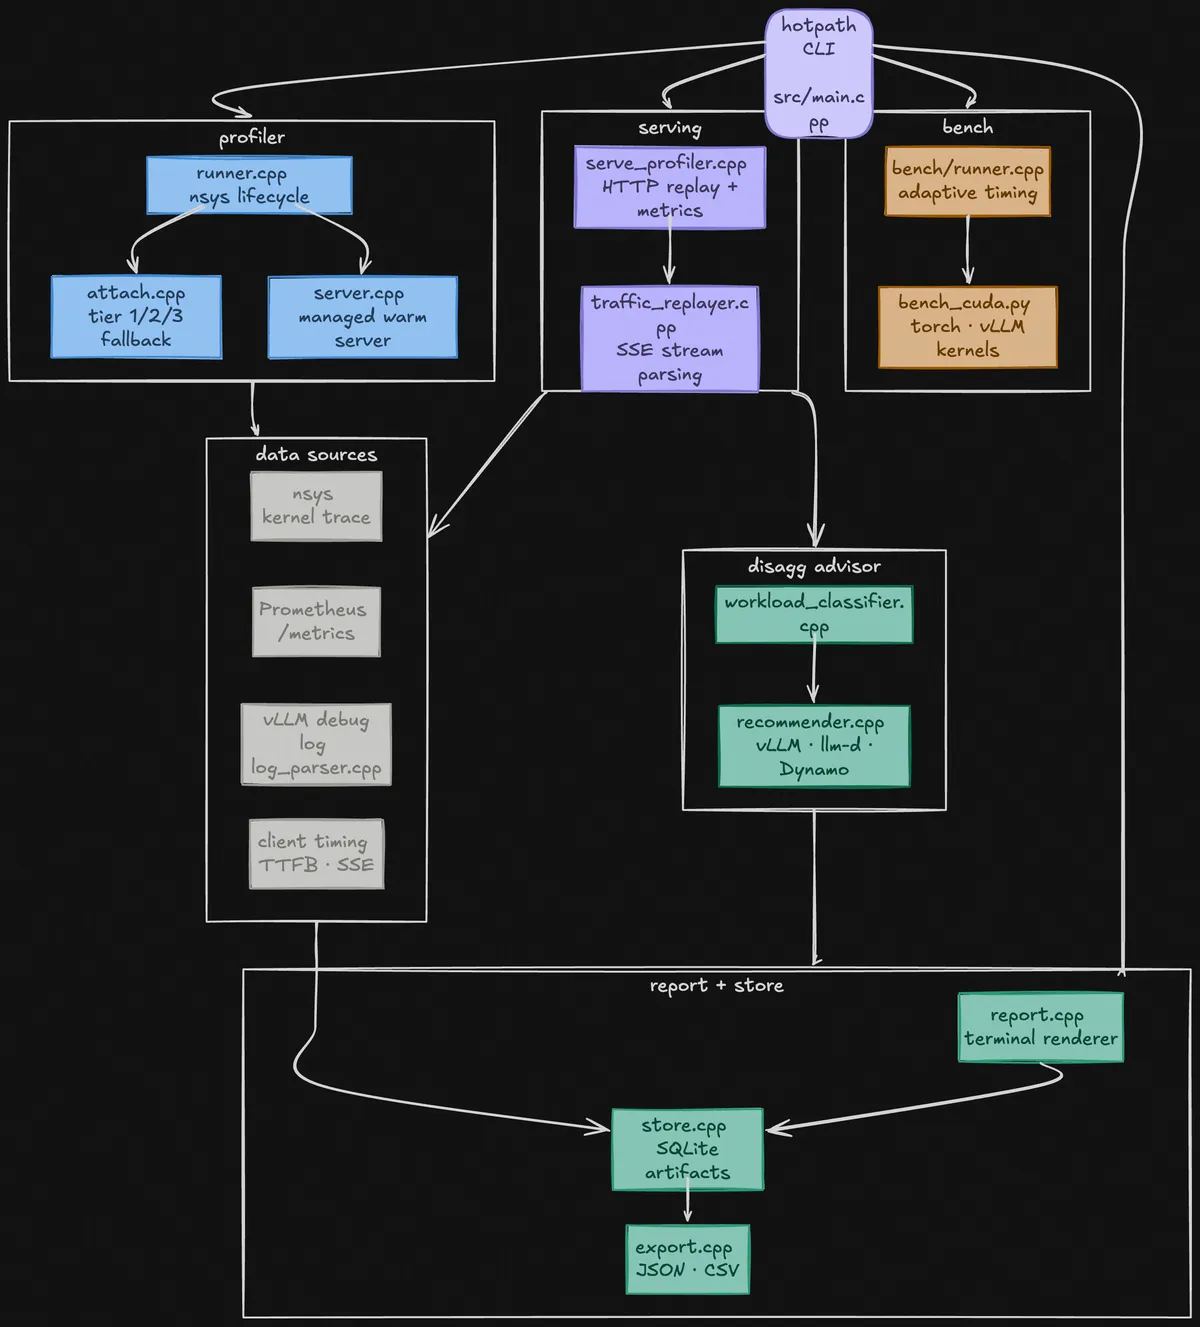
hotpath connects three sources: the GPU kernel trace, the server's internal metrics, and client-side timing. It tells you where your time goes whether that's prefill or decode.
Language models
When you send a message to a language model, a few things happen in sequence.
First, your entire input gets processed at once. The model reads every word you wrote, in one big forward pass through its neural network. This is called prefill. For a 500-word prompt, that's 500 tokens worth of computation happening simultaneously on the GPU. It's fast per-token but can still take hundreds of milliseconds for long inputs.
Then the model generates your response one token at a time. Each token requires its own forward pass. This is called decode. It's much slower added up, generating 200 tokens means 200 sequential passes, but each individual pass is small.
These two phases have completely different GPU characteristics. Prefill is compute-bound: the GPU is doing large matrix multiplications and working flat-out. Decode is memory-bandwidth-bound: for each new token, the model has to load its entire weight set from memory, but does relatively little computation.
Both phases share the same GPU. This creates a tension: if a long prefill from one user's request is running, every other user's decode steps have to wait. This is called head-of-line blocking, and it's the primary source of latency spikes in production LLM serving.
KV Cache
During prefill, the model computes three vectors for every token in your input. First is the Query (Q), what is the token looking for? Then it is the Key (K), what does this token contain? Finally, it is the Value (V), what should get passed forward if something matches the token?
For example, to compute how much token A closely matches to token B, you take the dot product of A's Query with B's Key. A high score means that they match and A should pay "attention" to B. Those scores are turned into weights via softmax, and the weighted sum of all Values becomes the token's output for that layer.
During prefill, you compute Q, K, and V for every token in your input simultaneously. During decode, you generate one new token at a time, but that new token still needs to attend to every previous token. So you need the K and V vectors for every prior token, every step.
This leaves you with two options: recompute from scratch every time, or store them. Since they won't change, the server saves them in the "KV Cache".
The KV cache is large. For Llama 3.1 8B (8 KV heads, 128-dimensional head, 2 bytes per value, 32 layers), a single token's K and V take about 8 * 128 * 2 * 2 * 32 = 131 KB. A 1024-token prompt fills 128 MB of GPU memory just for its KV cache. With hundreds of concurrent users, this fills GPU memory fast.
When the KV cache is full, the server has to evict an existing request to make room, this is called preemption. The evicted request restarts from scratch. You can see preemptions in the Prometheus metrics, and a high preemption rate is a strong signal that you're running the server too close to its memory limit.
One optimization to avoid this would be prefix caching: if two users send prompts that share a common prefix (a system prompt, a few-shot template), their KV caches for that prefix are identical. The server can store it once and reuse it. A high prefix cache hit rate means less prefill work, and faster time to first token (TTFT) for cached requests.
There are different ways to tackle prefix caching, for example SGLang implements this with a Radix Trie: a tree where each node is a token, and each path from root to leaf represents a sequence of tokens. Two prompts that share a prefix share a path in the trie, and the KV cache for that shared path is stored once at the shared node. When a new request comes in, the server walks the trie as far as it matches, loads the cached KV vectors for the matched prefix, and only runs prefill on the tokens that branch off. vLLM uses a simpler hash-based block cache where each 16-bytes block of tokens gets a hash, and matching hashes share blocks. This is easier to implement but can't match partial prefixes as efficiently as a trie.
How to measure?
Most LLM benchmarks report a single number: latency, or tokens per second. But there's no single "latency," there are at least four distinct things you might be measuring, and they tell you very different things.
The most common one (and the one most people care about) is time to first token (TTFT) which tells you how long after you send a message does the first word of the response appear.
A problem arises in the consistency of the reporting of TTFT, the most "obvious" ways would be to measure it from the client side using standard HTTP timing tools. But this actually gives you the wrong answer, because HTTP responses have a header section before the actual content. So you're really measuring time to first byte (i.e, when the headers arrived, not when the first token arrived). In our testing against a live vLLM server, headers arrived at ~4.2ms. The first actual token arrived at ~13.6ms. The server's own internal measurement (via its Prometheus metrics) confirmed 10–20ms.
What happens in the GPU
None of the signals above tell you what the GPU itself is doing. For that you need a different tool: NVIDIA's Nsight Systems (nsys), a low-level profiler that records every kernel (basically every individual computation) the GPU executes, with nanosecond timestamps.
A "kernel" here means a specific GPU function: a matrix multiply, a normalization operation, a softmax. The GPU runs thousands of these per request. nsys records them all into a timeline you can inspect.
The issue is nsys output is usually a large binary file designed for a GUI. And if you're running an LLM server (which serves many requests concurrently), the kernel timeline for any single request is interleaved with hundreds of others. There's no obvious way to say "show me what the GPU spent its time on for this specific request."
hotpath automates all of this. It starts nsys, sends requests through your server, stops nsys, exports the kernel data to SQLite, and correlates it with the other signals to give you a unified picture. The output is a single .db file you can compare across runs.
Warm servers
Every time you start vLLM, it has to load the model weights from disk into GPU memory. For a large model, this takes 30–60 seconds. If you want to run multiple profiling iterations, like comparing two different settings, you'd normally pay that startup cost each time.
hotpath lets you start a server once and keep it running between profile runs. When you run a profile, it opens a new measurement window on the already-loaded server, captures what happens, then closes the window.
The concern is obvious: does the warm server contaminate the measurements with startup overhead? Warm vs cold kernel totals for the same workload differed by 2915 nanoseconds across a ~7.3 millisecond GPU time window, a 0.04% difference. The 28 seconds of wall clock savings is entirely in model loading, none of it shows up in what the GPU measures.
An aside: Nsight Systems works by attaching a "session" to a process and issuing start/stop commands to open and close recording windows. hotpath uses one long-lived session per server, firing nsys start at the beginning of each profile window and nsys stop at the end. Each window writes its own output file. This is why multiple iterations produce valid, comparable artifacts.
How to leverage the server's metrics
Modern LLM servers (like vLLM and SGLang) expose a Prometheus metrics endpoint, a URL you can poll that returns a snapshot of the server's internal state. It is basically the server's dashboard: how many requests are queued, what percentage of GPU memory is in use, how long recent requests took to get their first token according to the server's own clock.
By polling this endpoint every second during a profile run and watching how the numbers change, you can extract things that no external observer could see:
TTFT: the server tracks time-to-first-token for every request internally. By reading the total sum and count at the start and end of your profile window and dividing, you get the mean TTFT for requests that completed during your run.
KV cache utilization: how full the cache was on average. High utilization means you're close to the preemption threshold.
Prefix cache hit rate: what fraction of tokens were served from cache rather than recomputed. vLLM 0.19 changed this from a single gauge to two counters (hits and queries), so the hit rate is now the delta of hits over the delta of queries.
vLLM debug logs
When you run vLLM with VLLM_LOGGING_LEVEL=DEBUG, it writes detailed per-request logs. This is where you can see exactly when the server received a request, when it started running it, and how long each phase took.
The problem is that vLLM's v1 engine emits two kinds of log lines, and they don't share IDs:
# This line has the request ID (with a vLLM-appended suffix)
Added request hp-req-042-7f4a9b: prompt="Explain attention..."

# This line has the timing — but no request ID
Running batch [EngineCore] BatchDescriptor(num_tokens=148)
  prefill_time=0.611s  decode_time=7.244s
The first line tells you which request ran. The second line tells you how long things took. But they're separate, there's no shared ID connecting them. An early version of hotpath could match requests by ID but had to throw away all the per-phase timing because those lines had nothing to identify them.
The fix: hotpath strips the suffix vLLM appends to our injected request ID, then correlates the request lines with the anonymous batch descriptor lines using timing proximity and token count. This is what enables the breakdown you see in the report:
Prefill and decode on separate machines?
Since prefill and decode are so different computationally, a natural question is: what if you ran them on separate GPU instances? Prefill instances handle incoming prompts. Decode instances handle token generation. They coordinate by sending the KV cache over the network.
This is called disaggregated serving, and in the right workloads it can meaningfully improve throughput and TTFT. The reason: a dedicated prefill instance can start processing new requests immediately rather than waiting for decode to free up GPU time. The head-of-line blocking problem largely goes away.
But it's not always worth it. You're adding network latency for KV cache transfer, operational complexity, and cost. The answer depends on your specific workload.
hotpath's advisor uses the measured phase timing, contention estimate, and workload class to answer the question. The contention estimate is simple: (p99 decode latency − median decode latency) / median decode latency. If p99 is much higher than median, requests are blocking each other, and disaggregation helps. If they're similar, your server isn't particularly congested and the overhead isn't worth it.
hotpath  Qwen/Qwen2.5-3B-Instruct  ·  vllm  ·  1x
NVIDIA A10G
20 req  16.6s  1.2 req/s  srv-log  pfx-cache
────────────────────────────────────────────────────
                           p50        p90      p99 ▴
 queue wait             312 µs     332 µs     332 µs
 prefill (server)     381.2 ms   404.6 ms   404.8 ms
 decode (server)     4093.7 ms  4476.9 ms  4664.6 ms
 decode / token        19.5 ms    19.7 ms    19.7 ms
 ▸ end-to-end        4158.8 ms  4499.4 ms  4690.0 ms
────────────────────────────────────────────────────
kv hit rate        96.7%  unique prefixes        1
avg usage          24.7%  cacheable tokens   91.1%
peak usage         43.8%  actual hit rate    96.7%
evictions              0
────────────────────────────────────────────────────
advisor               ✓ MONOLITHIC
min bandwidth        29 Gbps  ⚠ below this disagg hurts
note                 advisor estimates do not
                     include GPU phase data
────────────────────────────────────────────────────
hotpath disagg-config serve_profile.db  →  vLLM / llm-d / Dynamo
What's next
There are a few things I missed such as not using GPU phase data (current using server-side timing) or not considering speculative decoding. Normally a model generates one word, then the next, then the next. Speculative decoding is a shortcut where a smaller cheap model guesses the next several words ahead, and then the main model checks all those guesses at once in a single pass.
That checking step is the problem, since it looks identical to processing a new prompt: same GPU pattern, multiple tokens handled in parallel. Currently, hotpath sees it and thinks "oh, lots of prefill happening!" and might tell you to split your server into separate prefill and decode machine. But that would be the wrong move, since you don't have a prefill problem.
Anyway, install using
# Install
uv tool install hotpath
Open any issues or PRs on the Github!